50% of schools in the US have been diagnosed with poor indoor air quality.1 Poor indoor air quality can decrease alertness, productivity and test scores, as well as increase sick leave for both students and teachers. Studies show that classroom CO2 levels of 2500 ppm had much worse test scores than at 1000 ppm.2
Improve productivity of students and staff, reduce absenteeism and create a healthy environment
Easily visualize, manage and share historical and live air quality data with stakeholders
Gain deeper insights into your HVAC system operation, management of filtration and ventilation rates
Optimize building operation and energy consumption, save money and increase ROI
Easily comply with CO2 regulations and recommendations, create trust with parents, teachers, students
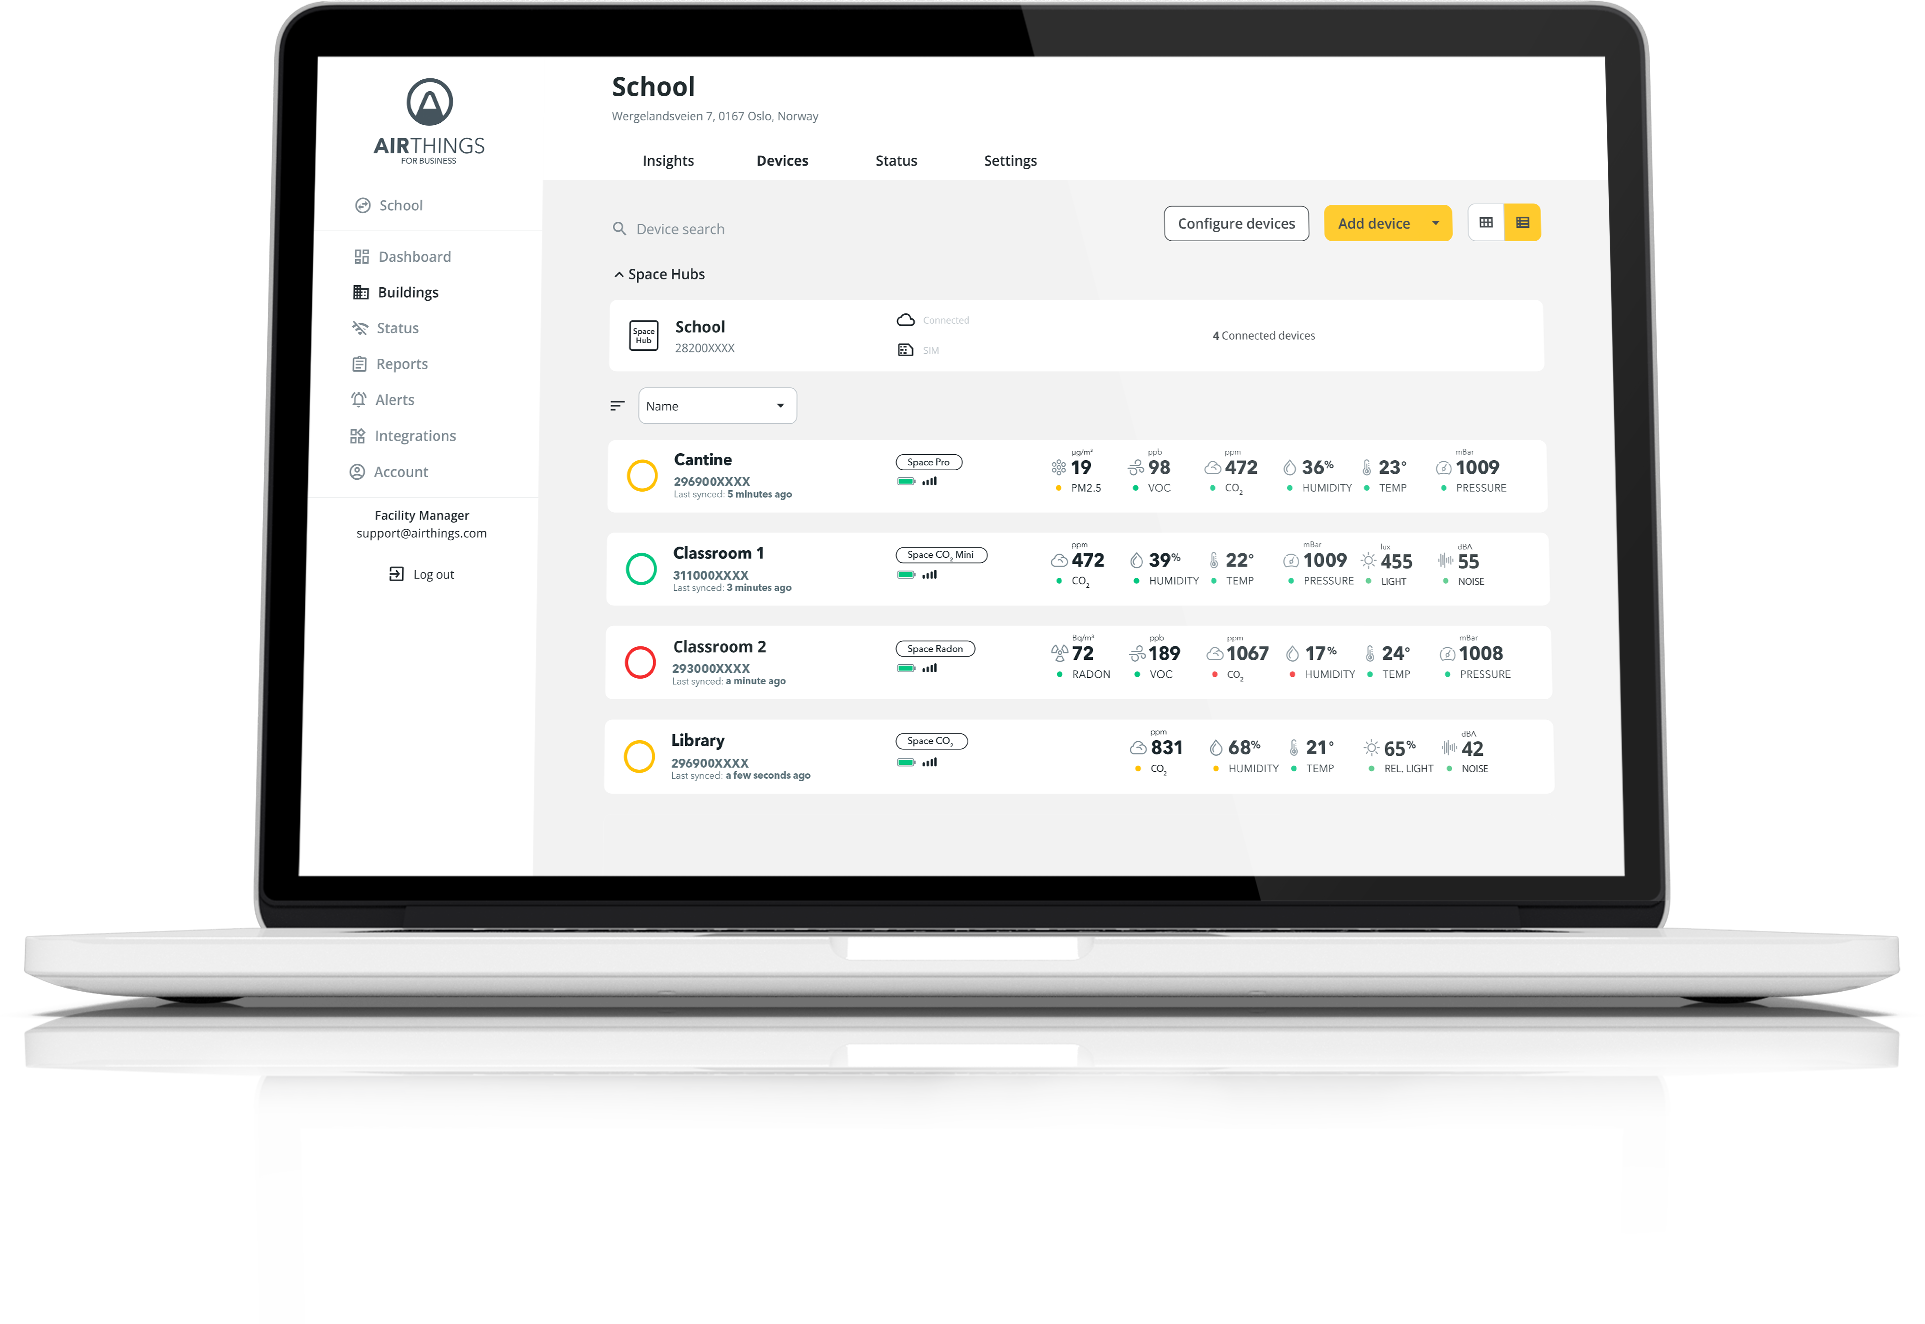
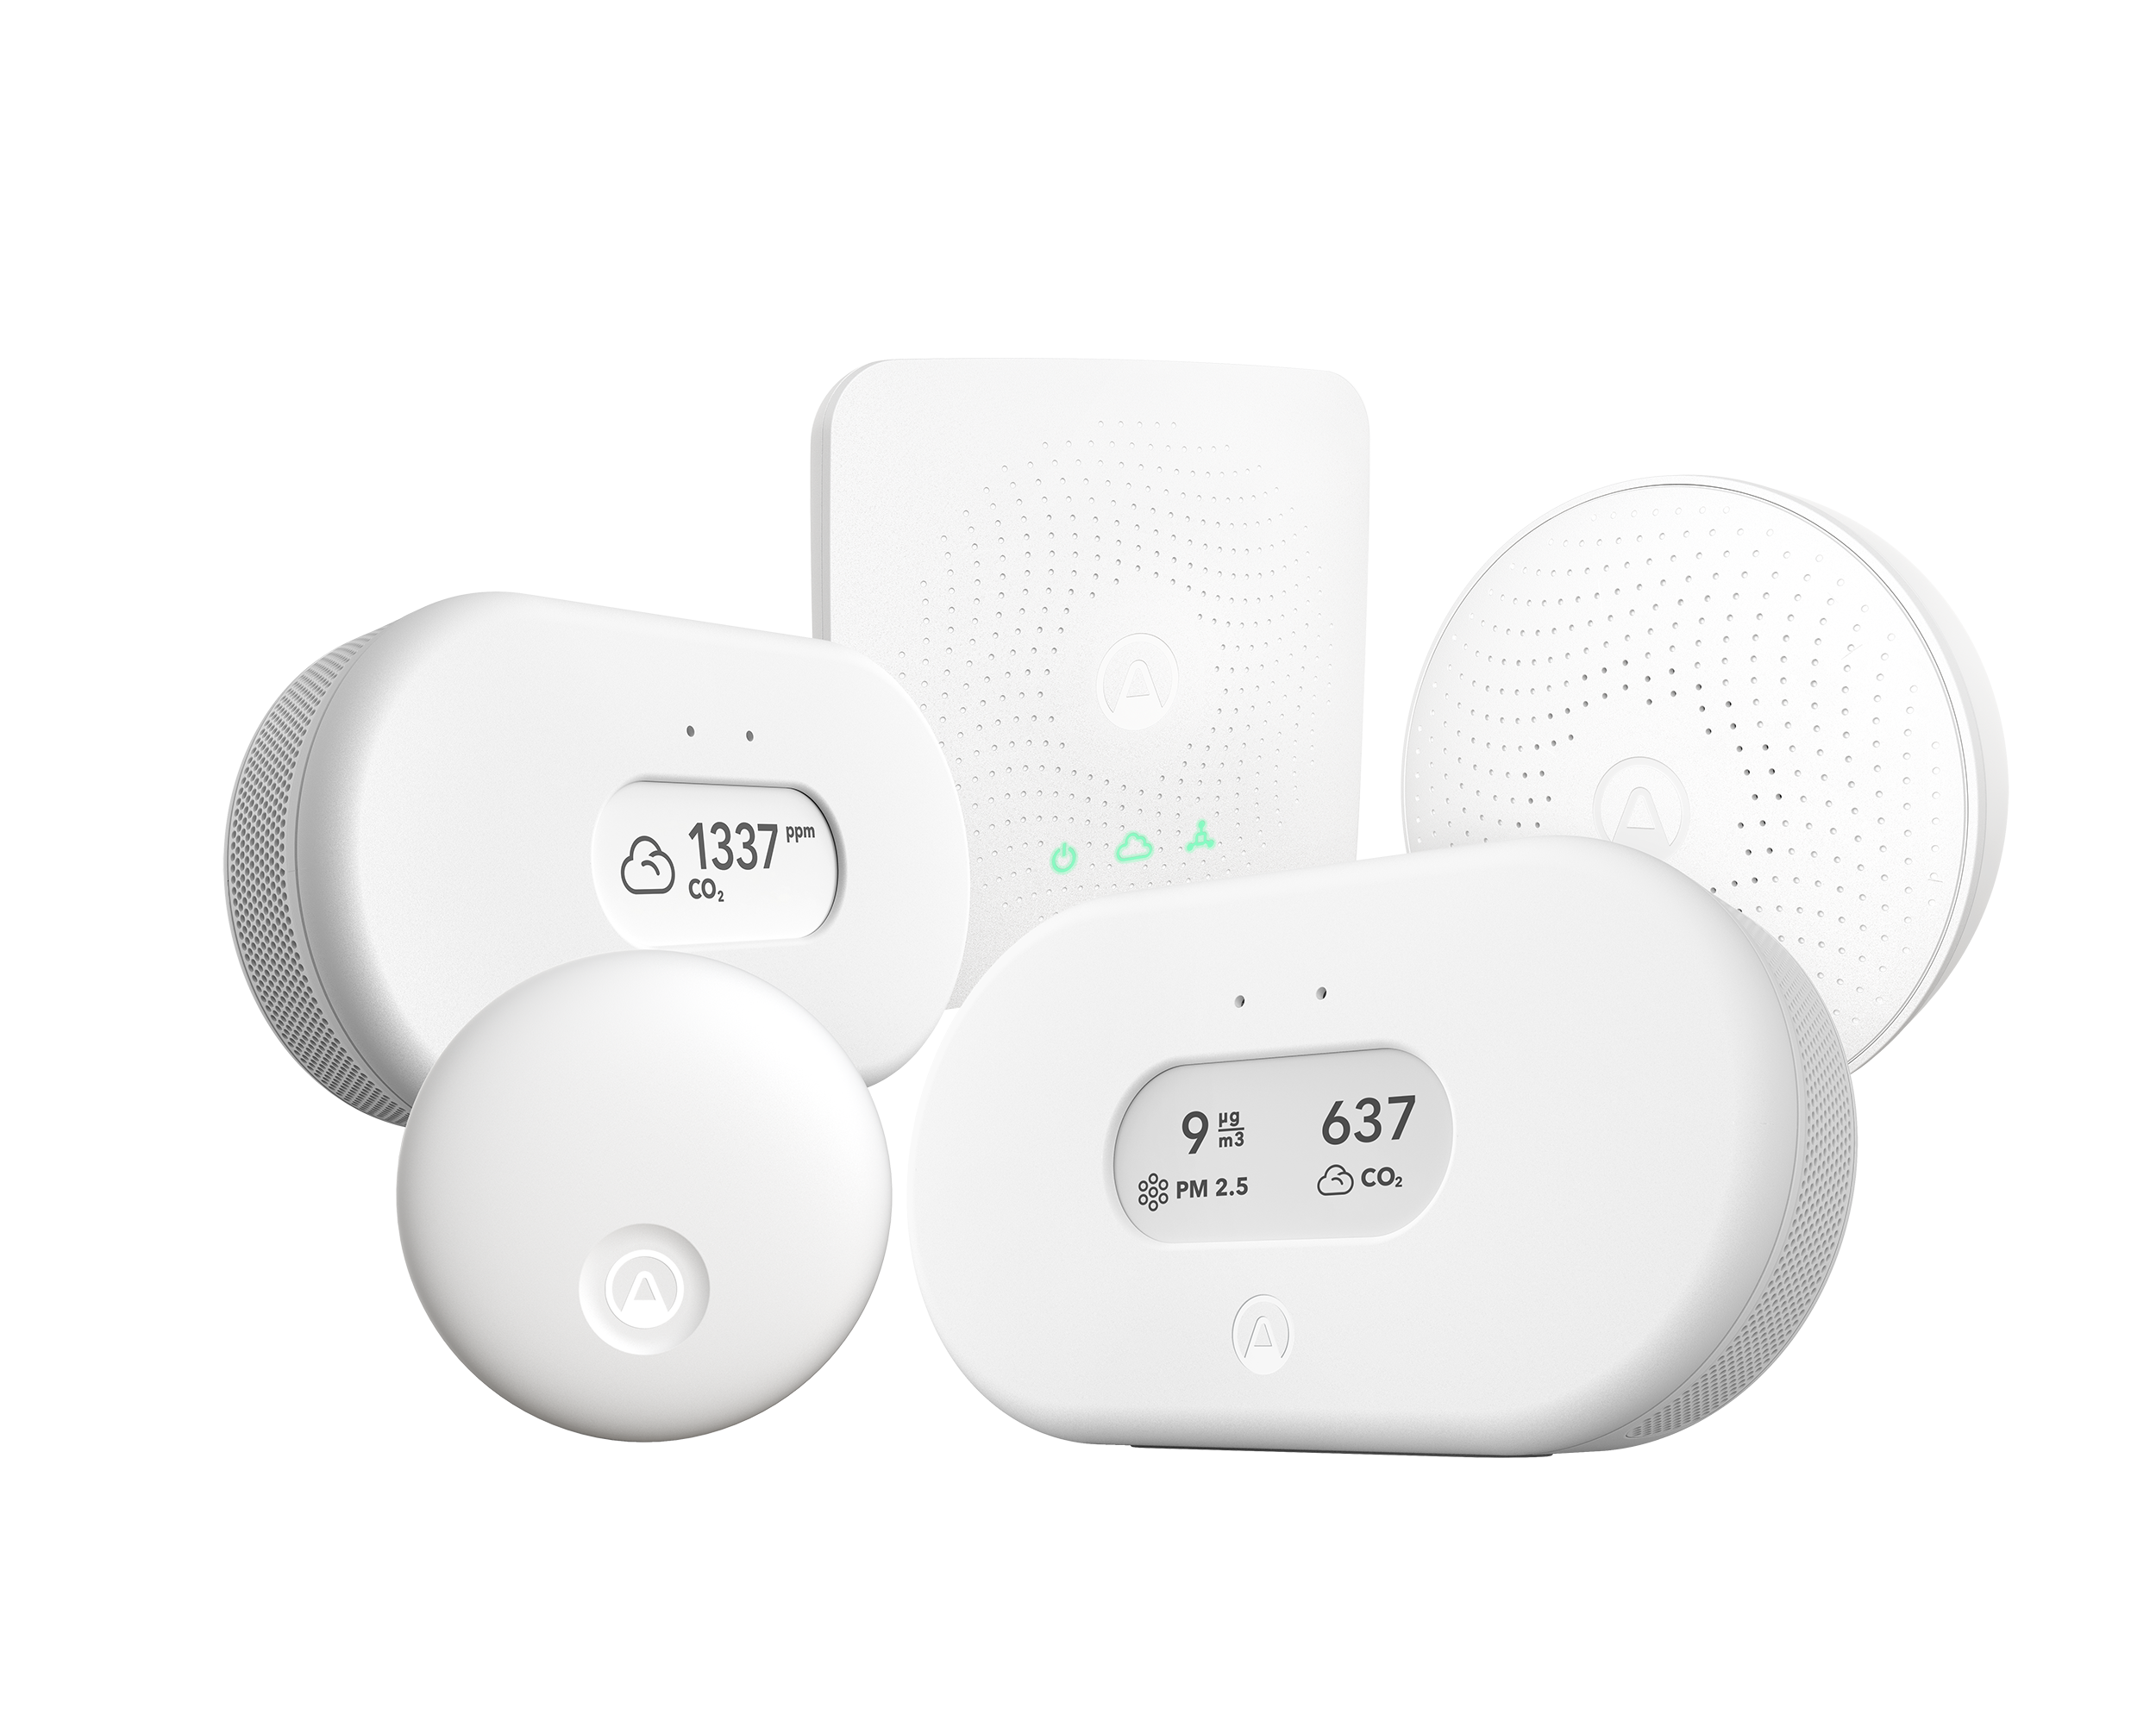
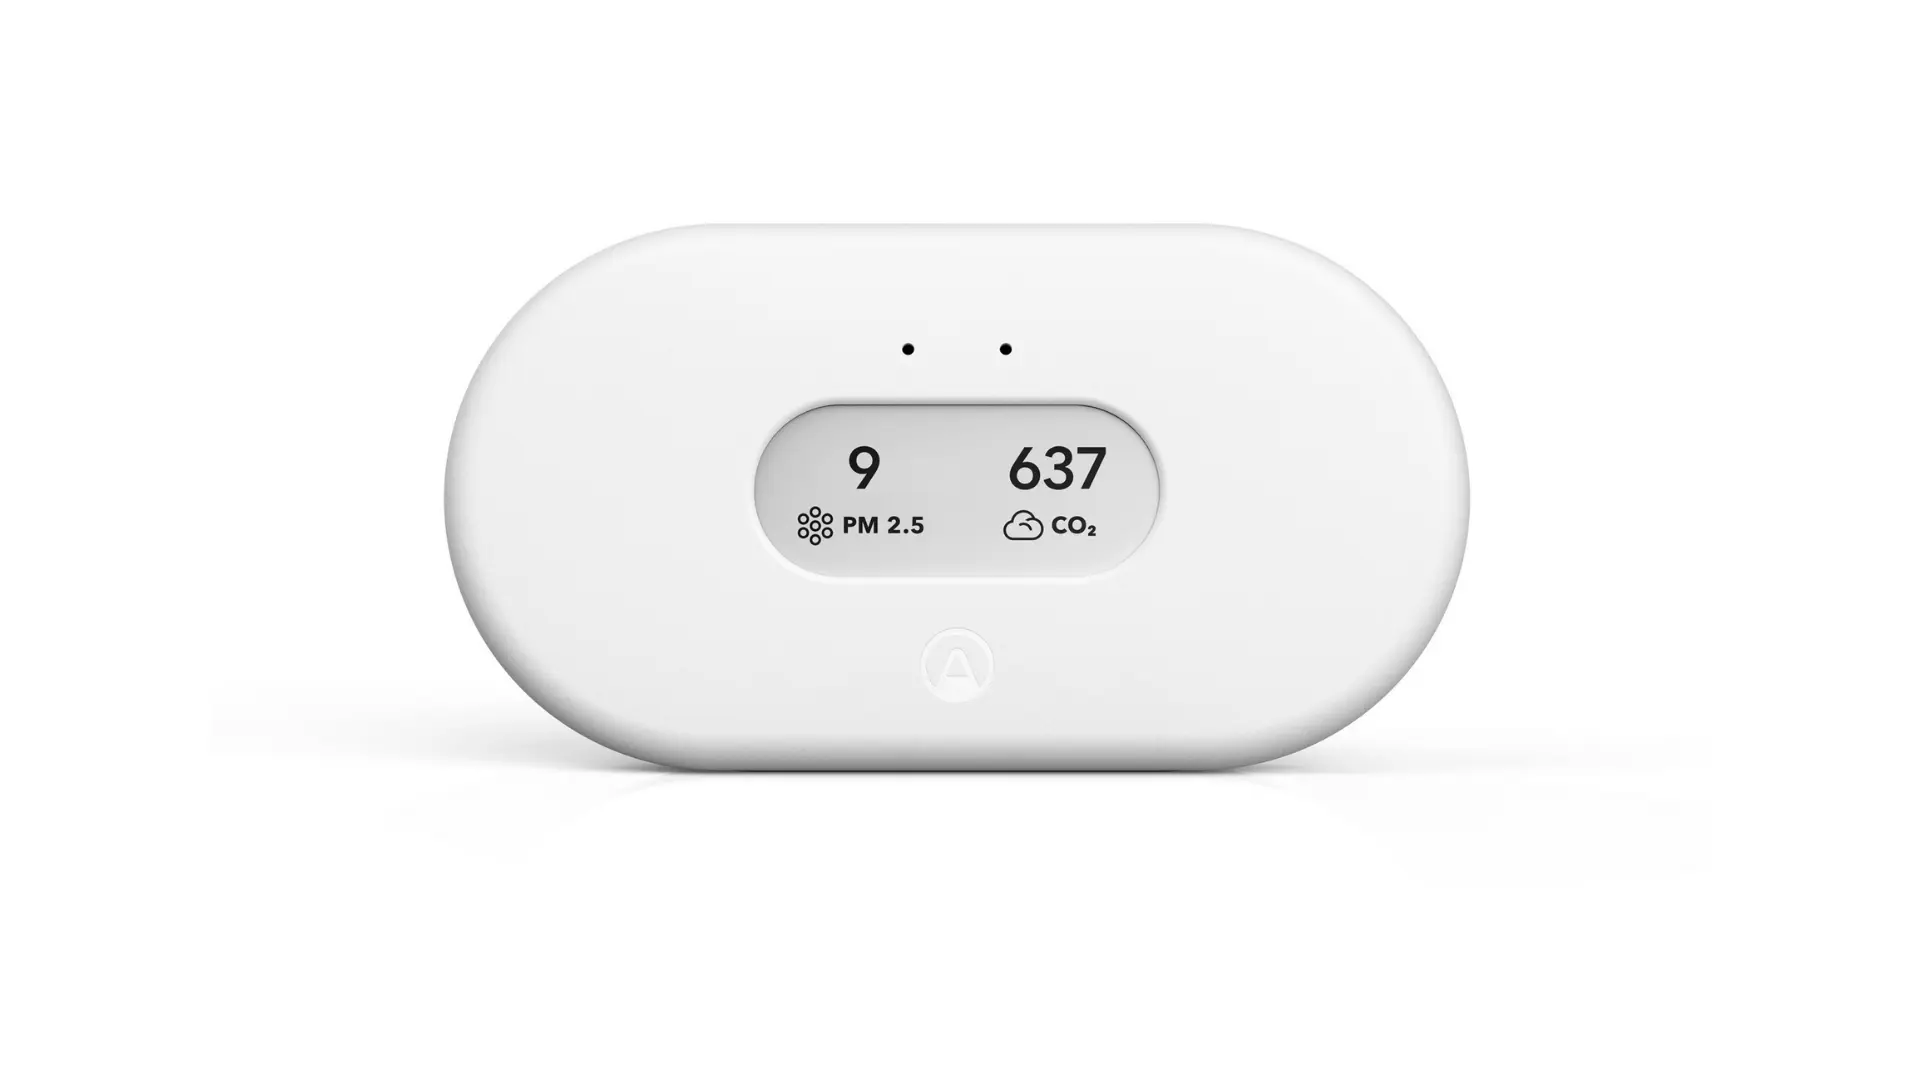
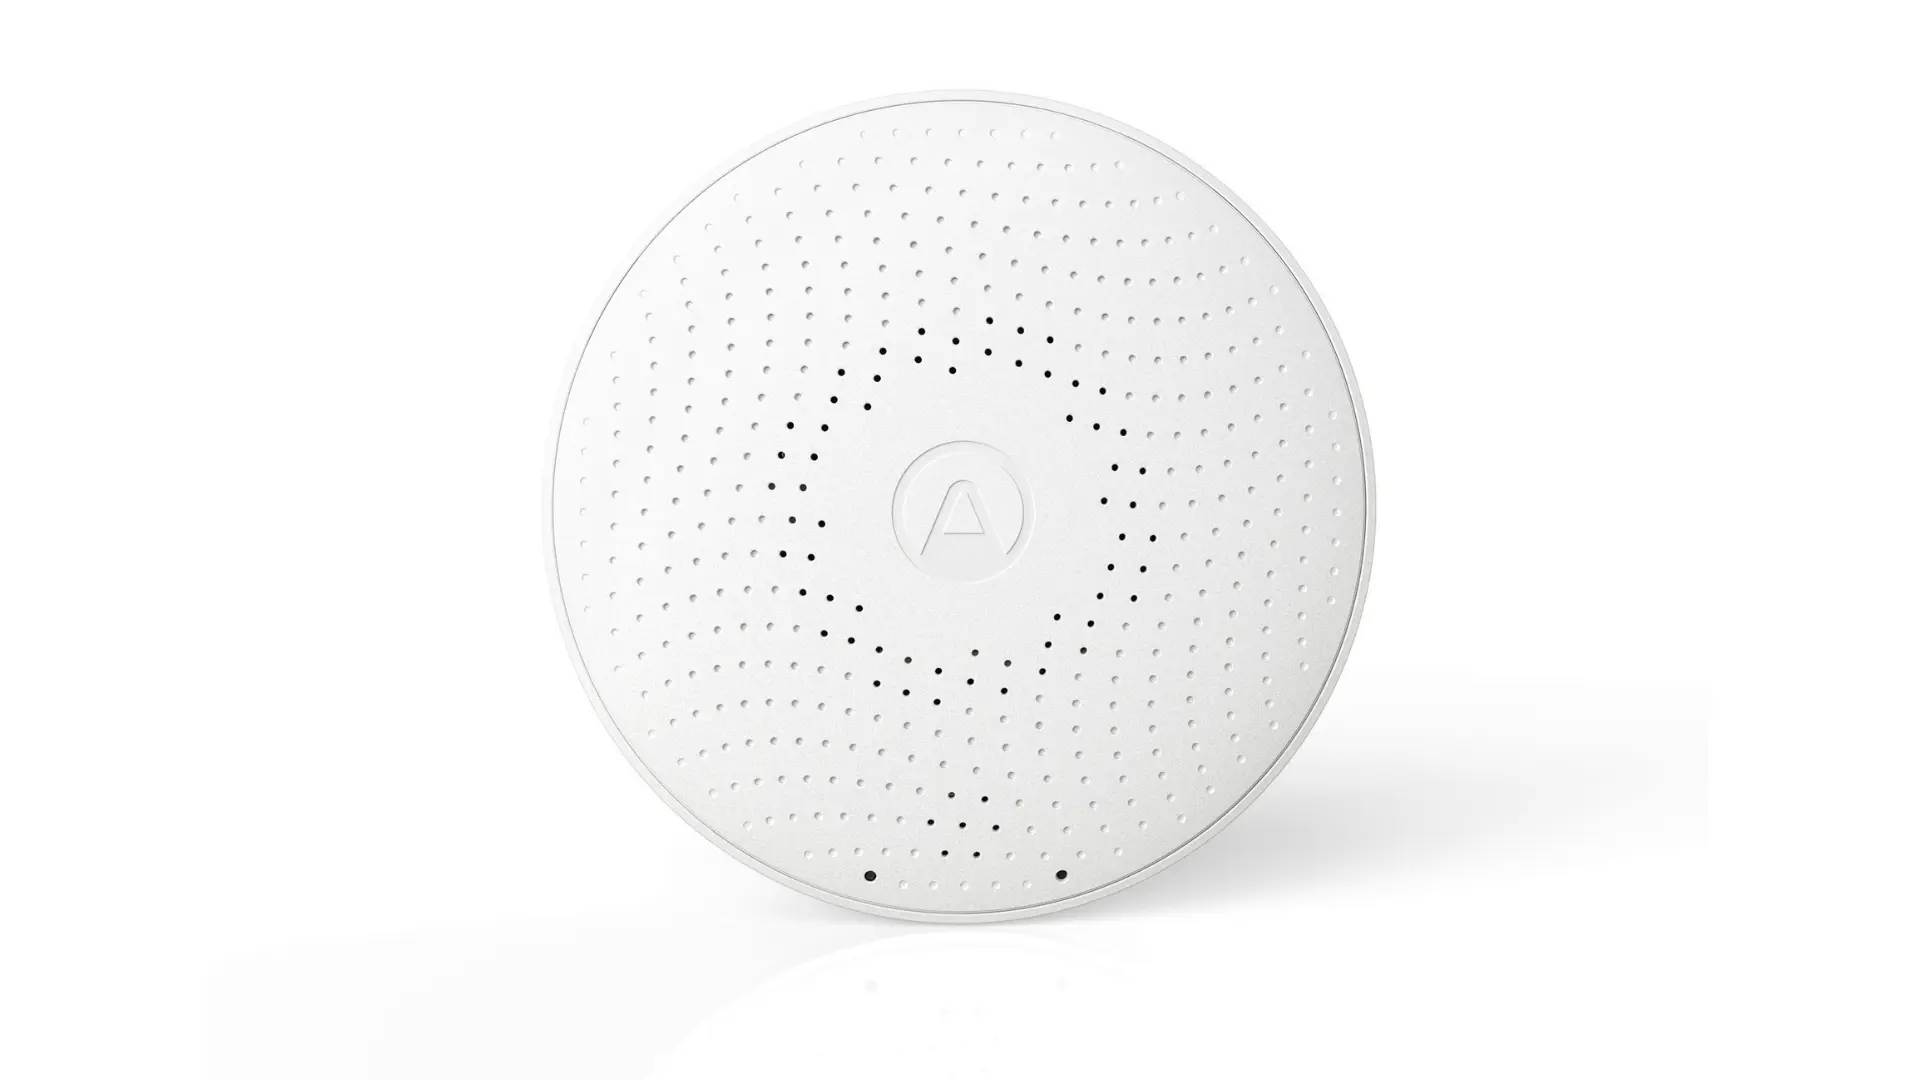
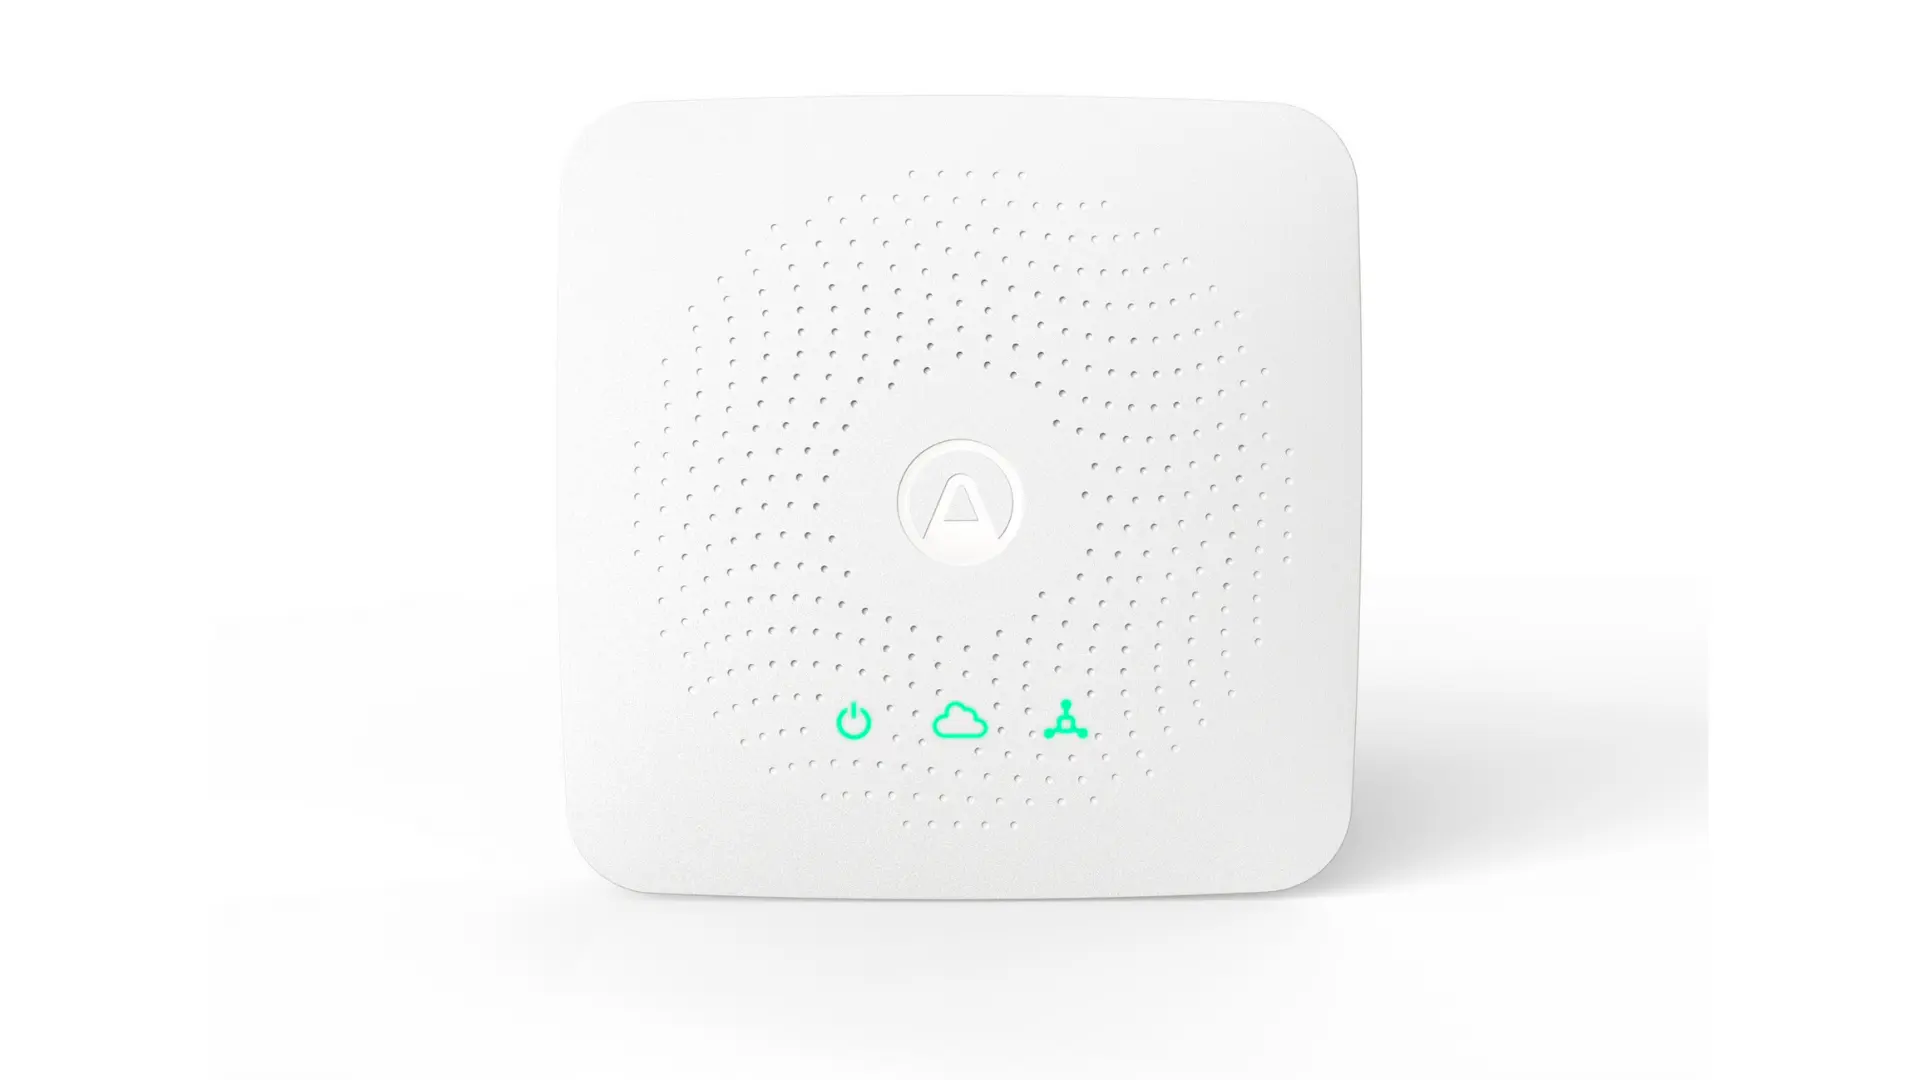
Our battery-powered air quality monitors are easy to install and don’t need drilling or wiring. Within minutes, you’ll see your air quality in the Airthings Dashboard.
Use real-time and historical air quality data to manage all of your spaces in one place. Set up alerts that notify when air is unhealthy and generate reports.
Ensure trust by showing your current air quality through Public Dashboard display, QR codes or generated reports.
Optimize your building operation through ventilation, heating, cooling and more based on need instead of schedule, so you are only using energy when you need to.
Assess performance of HVAC system, manage filtration, eliminate faults and inefficiencies and know that your fixes work.
Whether you have 1,000 sq ft or 1,000,000 sq ft, our solution can meet your indoor air quality needs.
CO2
Radon
PM1
PM2.5
Relative humidity
Temp
Airborne chemicals (VOCs)
Pressure
Differential Pressure
Light
Noise
Virus Risk
Mold Risk
CO2
Carbon Dioxide (CO2) is the air we breathe out, which impacts health and productivity. The level of CO2 in the air is a good indication of a room's ventilation.
Radon
A radioactive, invisible gas that comes from the ground. It is the largest cause of lung cancer among non-smokers2.
PM1
Particulate matter is a range of particles of dust, dirt, and aerosols that become suspended in the air. PM1 has a diameter of less than 1 micrometers and is invisible to the eye.
PM2.5
Particulate matter is a range of particles of dust, dirt, and aerosols that become suspended in the air. PM2.5 has a diameter of less than 2.5 micrometers and is invisible to the eye.
Relative humidity
When humidity levels are too high, mold and rot can occur while low humidity levels can encourage airborne virus spread and increased susceptibility to colds and respiratory illness.
Temp
Temperature affects mood, comfort level, and alertness.
Airborne chemicals (VOCs)
VOCs (volatile organic compounds) are odors and gaseous toxins, causing short- or long-term health effects from minor eye, nose and throat irritations to liver and kidney damage.
Pressure
The weight of the air, technically called barometric pressure, can cause headaches, joint pain, and fatigue.
Differential Pressure
The difference of pressure between two points. Unbalanced air pressure leads to energy losses from leakage and infiltration.
Light
Monitoring when the lights are on or off in a space can help identify wasted energy usage.
Noise
Noise level should be kept between optimal ranges in areas of long exposure to boost productivity and concentration. High noise levels can leave people with long-term damage. We measure sound intensity in dB(A) and no sound is recorded.
Virus Risk
The calculation of how conducive your indoor environment is to the survival of airborne viruses and likelihood of transmission.
Mold Risk
A calculation of how conducive your indoor space is for mold growth. Mold thrives in poorly ventilated, humid spaces and is harmful to people’s health.
Healthy air quality was top of mind for this school district. With the help of Airthings air quality data, they found they could seriously reduce energy costs.
Learn moreLife Chiropractic College West improved their students' and staffs' wellbeing by utilizing air quality data from Airthings.
Learn moreWatch our free webinar and learn about CO₂ monitoring strategies and legislation for safe and productive learning environments.
Watch here
|
|
||||
|
|
||||
|
|
||||
|
|
||||
|
|
||||
|
|
||||
|
|
||||
|
|
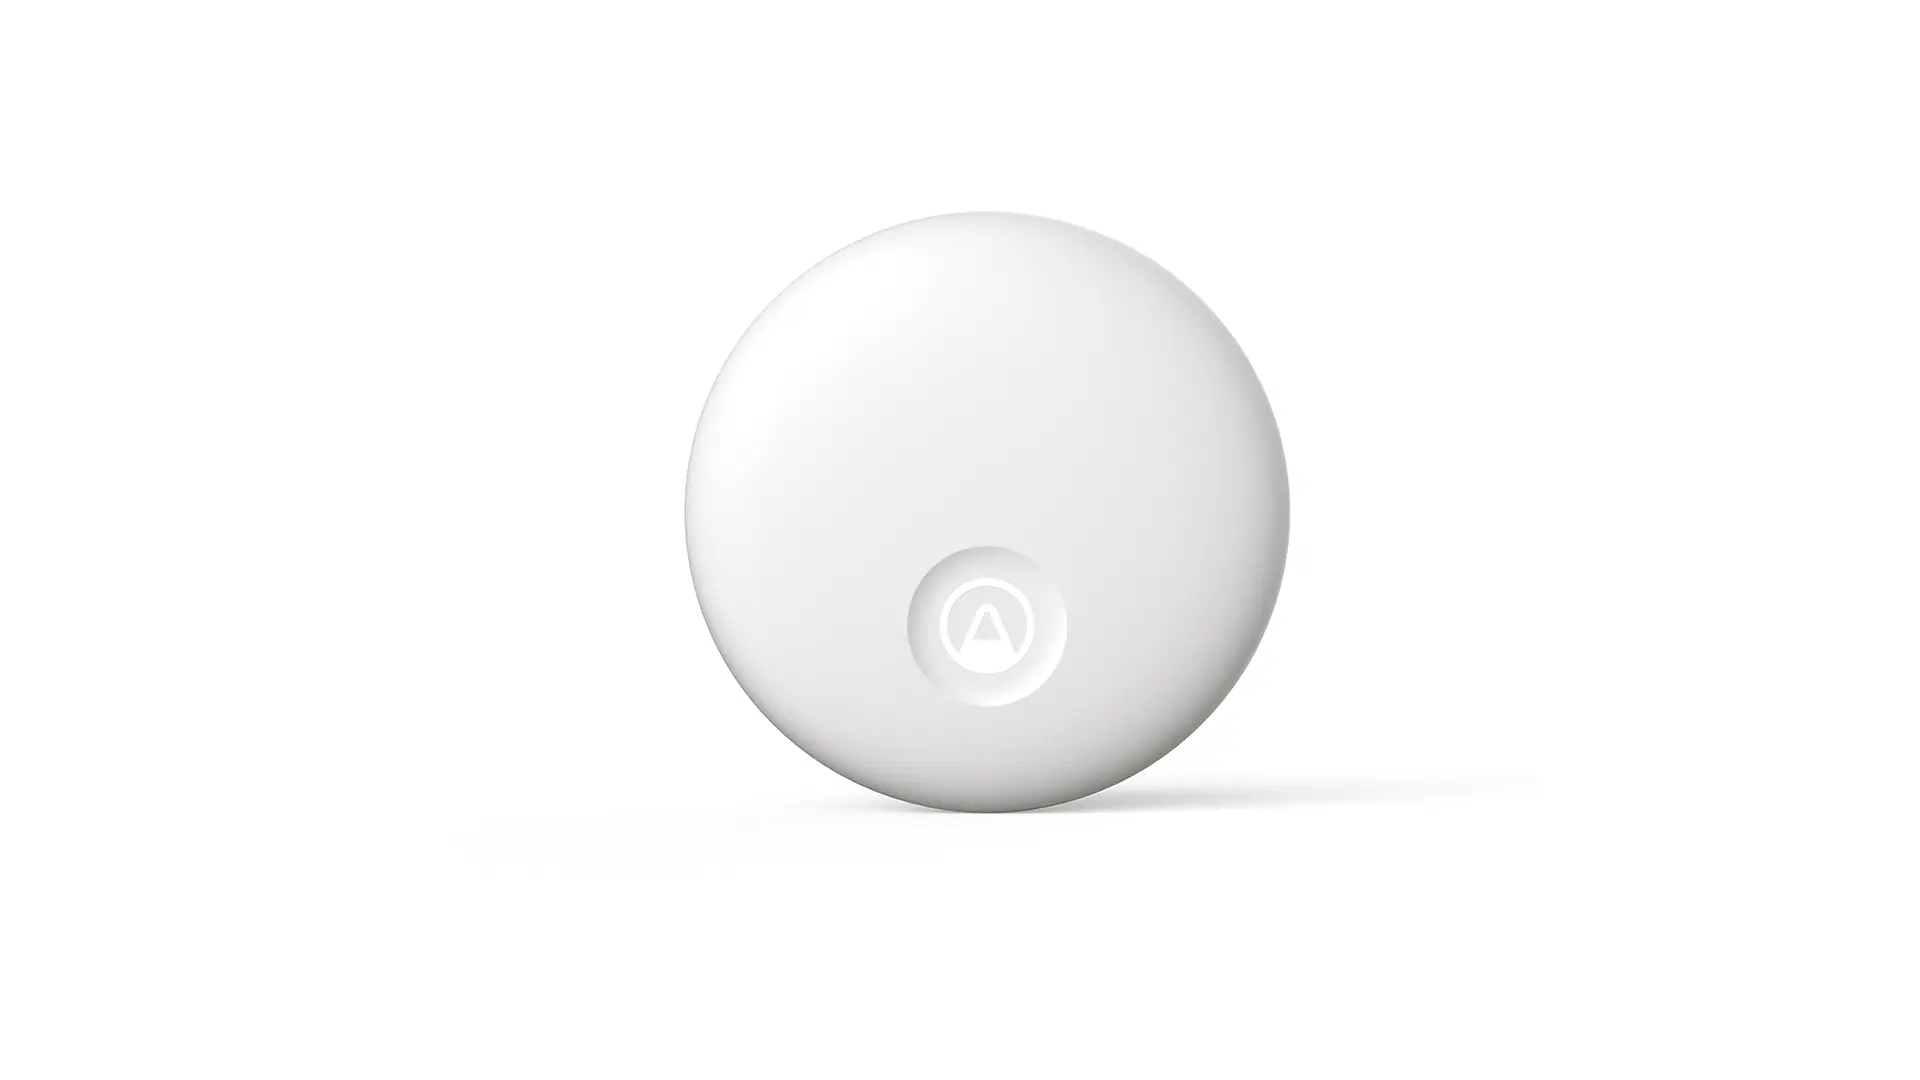
Our most compact, resilient device with up to 20 years of battery life. Perfect for hard-to-reach locations.
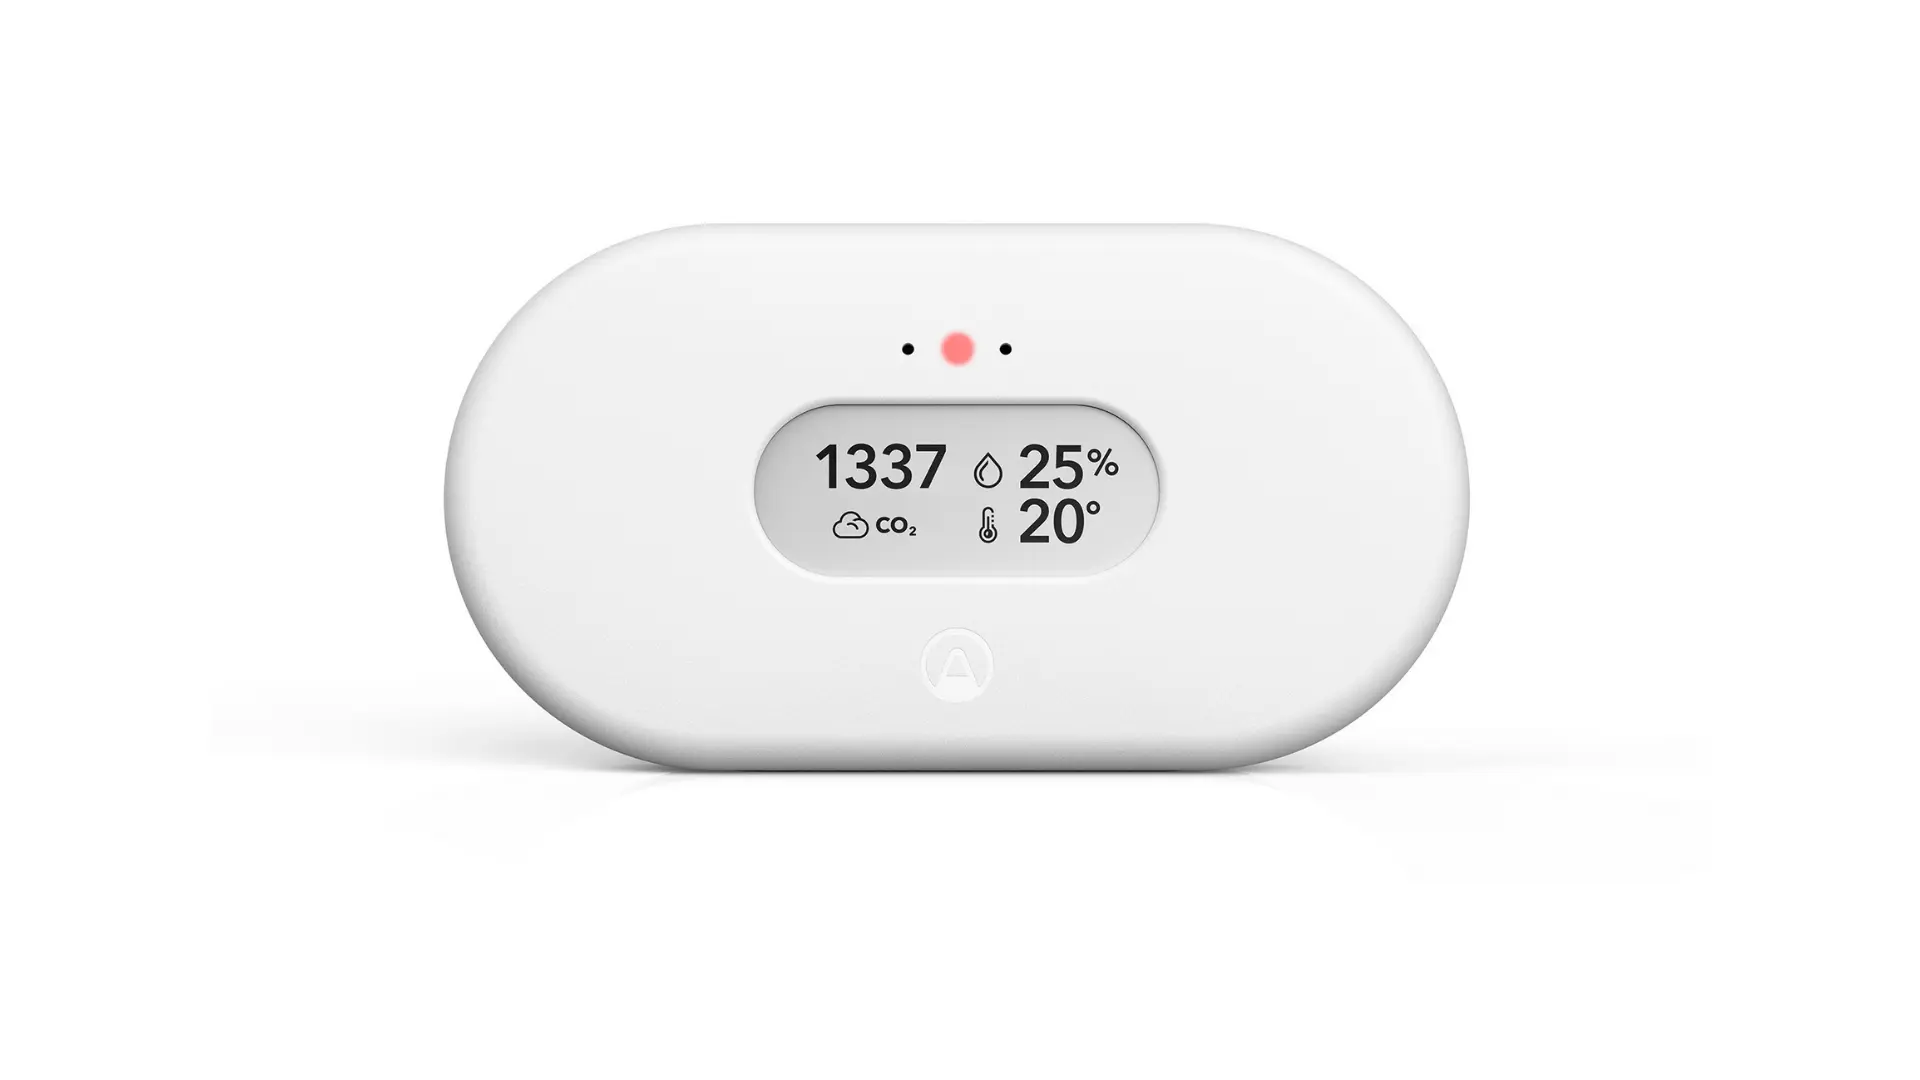
Wireless monitor for CO2, temperature, light (lux), noise, and virus risk.
Contact us to learn more about monitoring the air quality in your building today.
Get in touch Or find a sales rep?