Do you know what’s in the air you breathe? According to the EPA1, we spend 90% of our time indoors, with the recent social distancing measures even more, and contrary to popular belief, the air in our homes is typically 2 to 5 times worse than outdoors2.
As breathing in clean air is central to our wellbeing, Airthings data analysts looked at our data to uncover what’s happening to the air quality in our homes as many are required to stay in. Here’s what we discovered.
Key takeaways
- In the United States, the average CO2 levels increased by 15% after social distancing measures started; in Norway by up to 20%.
- The percentage of Airthings’ monitors indicating poor indoor air quality tripled both in the United States and in Norway.
- The United States had a much higher average airborne chemical levels than Norway before the lockdown, showing little increase after people started staying at home.
- In Norway average airborne chemical levels increased by up to 30%.
PRESS CONTACT

Nora Perez
PR & Events Manager
press@airthings.com
Air quality decreases as people work from home
We’re all spending more time inside—working remotely, homeschooling our kids, exercising in the living room. With closed windows and more people in the house, CO2 levels can rise quickly since we expel it when we breathe.
As people started to work from home in mid-March, we see a spike in the average CO2 levels during work hours both in the United States and in Norway. In the US, average CO2 levels increased by 15% and in Norway by up to 20%, similar to other countries like Denmark and Finland.
Average CO2 levels in Norwegian homesCopy graph embed code. |
Average CO2 levels in US homesCopy graph embed code. |
Average CO2 levels by state in the USCopy graph embed code. |
|
The effects of indoor carbon dioxide
Studies3 have shown that high CO2 and poor ventilation leads to decreased cognitive performance. Whereas, higher concentrations of CO2 can also cause headaches, restlessness, drowsiness, poor sleep, snoring, and other problems. When levels reach 1,000 ppm scientists find a notable decline in decision-making capabilities, while 1,400 ppm sees a 50 percent drop in cognitive ability4.
An easy way to improve the airflow throughout your house is by opening windows or vents for 5 to 10 minutes, several times a day.
Cooking and cleaning: a source of air pollution
Airborne chemicals (VOCs) are found in everyday products and materials including mattresses, household cleaners, carpets, furniture, paint, and even breath. In enclosed spaces, like our homes or offices, these emitted gases accumulate and can pollute our air.
As we are working from home and have our kids in the house, activities that would usually wait until after work, such as cooking or cleaning, are more frequent. In the following graphs, we see how the average airborne chemical levels increased after people started working from home.
Average airborne chemical levels in NorwayCopy graph embed code. |
Average airborne chemical levels in the USCopy graph embed code. |
In Norway, we see up to a 30% increase in the average levels of airborne chemicals since social distancing measures started.
Interestingly, we noted that the United States had a much higher airborne chemical level than Norway before the lockdown, so the level didn’t increase much when people started staying at home. The lack of change might have to do with the different ventilation systems used in the two countries.
Reducing airborne chemicals in the home
According to the EPA5, airborne chemicals can irritate our eyes, nose, and throat, set off asthma and other allergies, and give us headaches. Long-term exposure and high concentrations can lead to serious health conditions.
Ventilation is an effective way to reduce airborne chemical concentrations in our homes. Choosing household products with low-VOC toxicity, buying natural cleaners, detergents, and even used furniture can help lower the total airborne chemical levels indoors as well.
Monitoring air quality at home, more important than ever
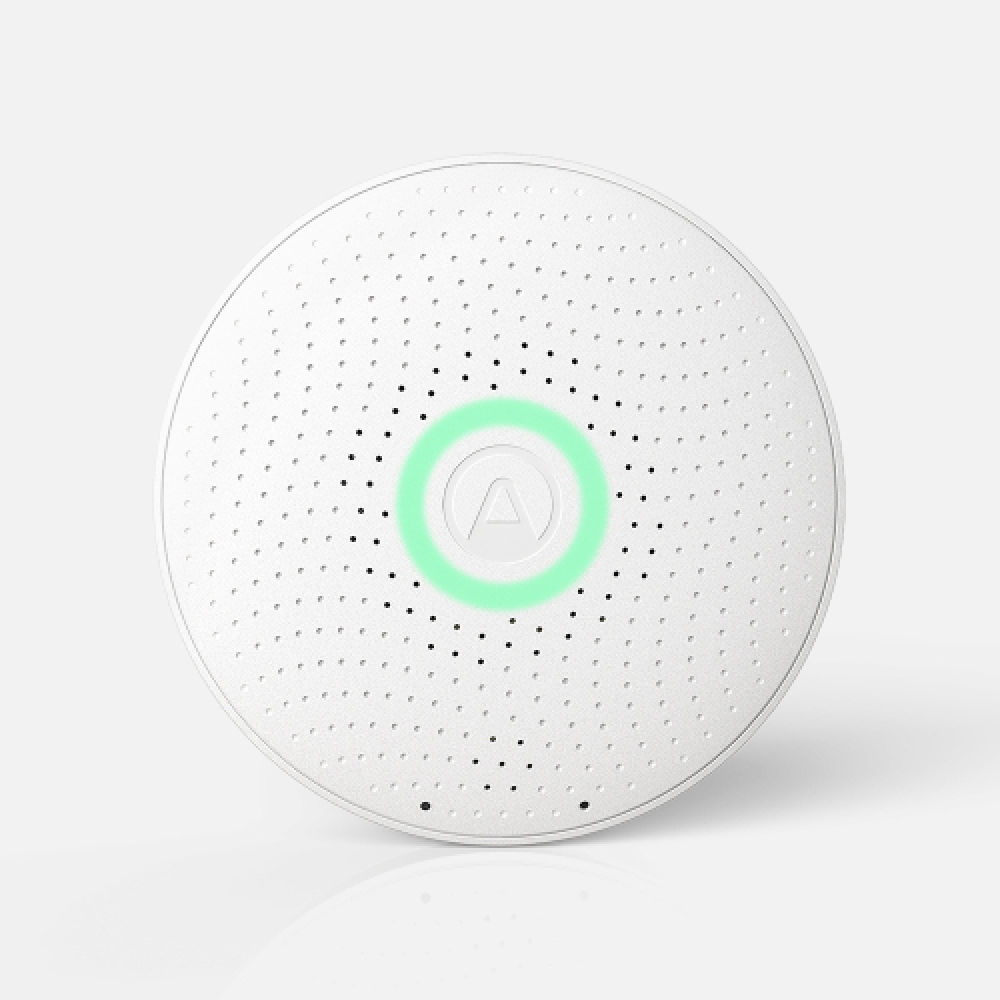
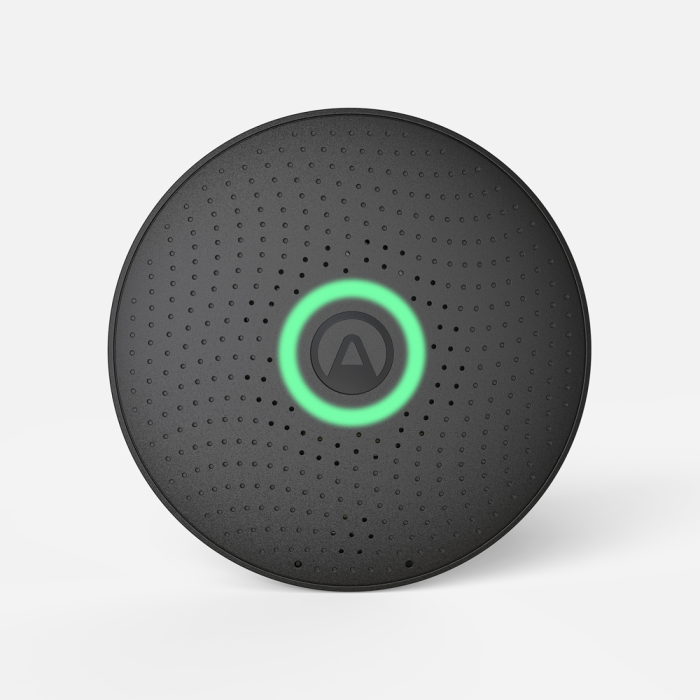
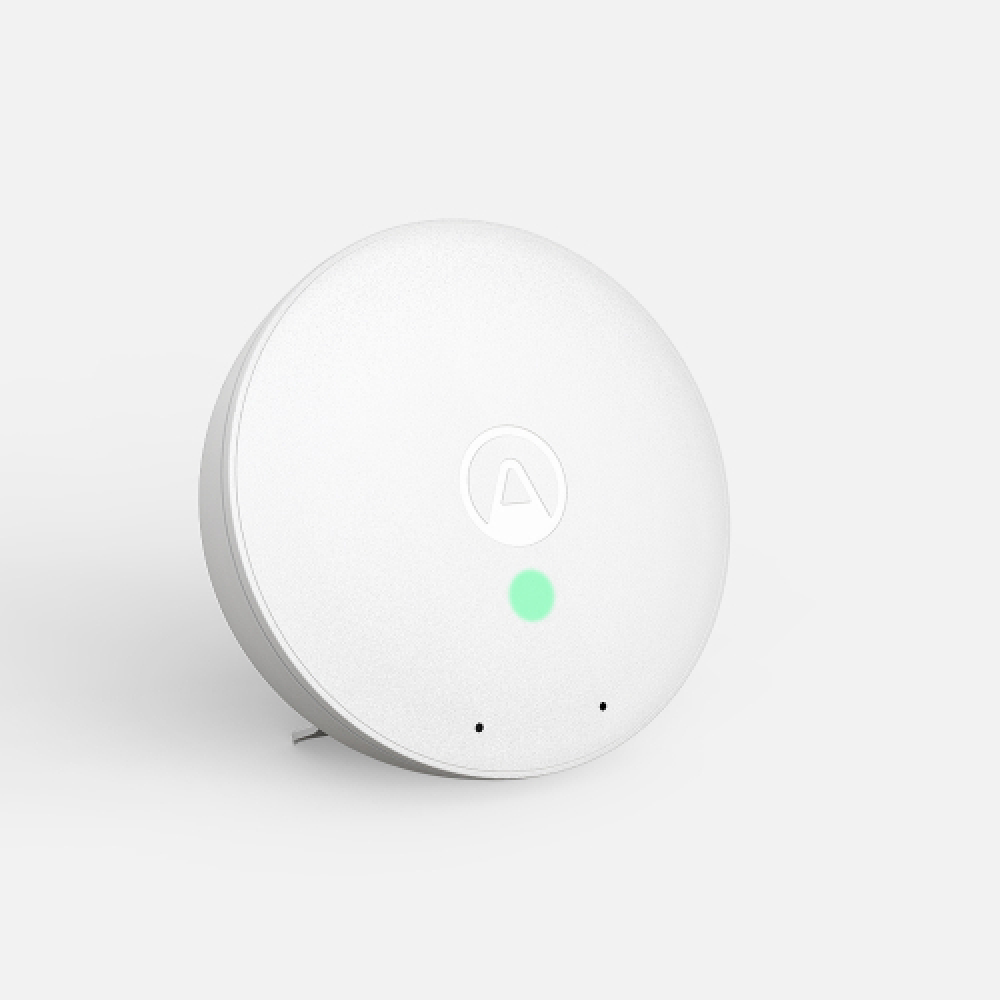
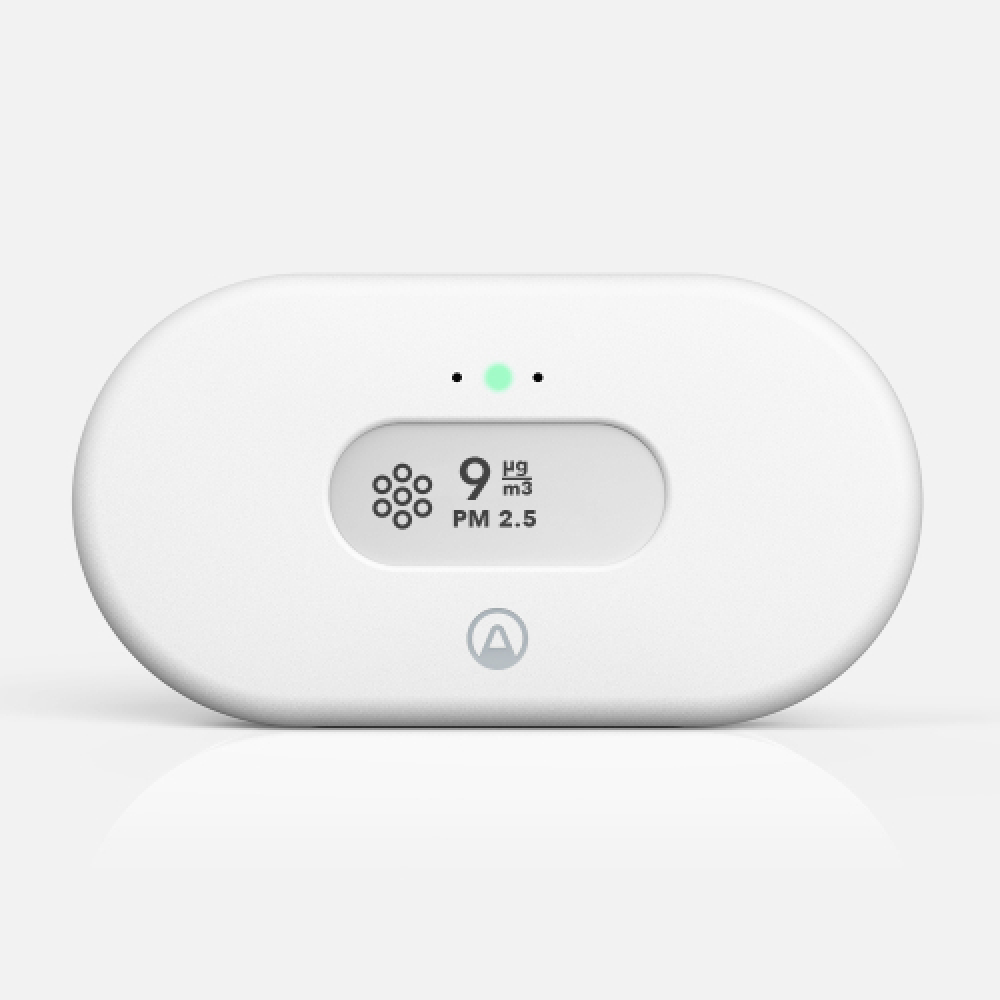
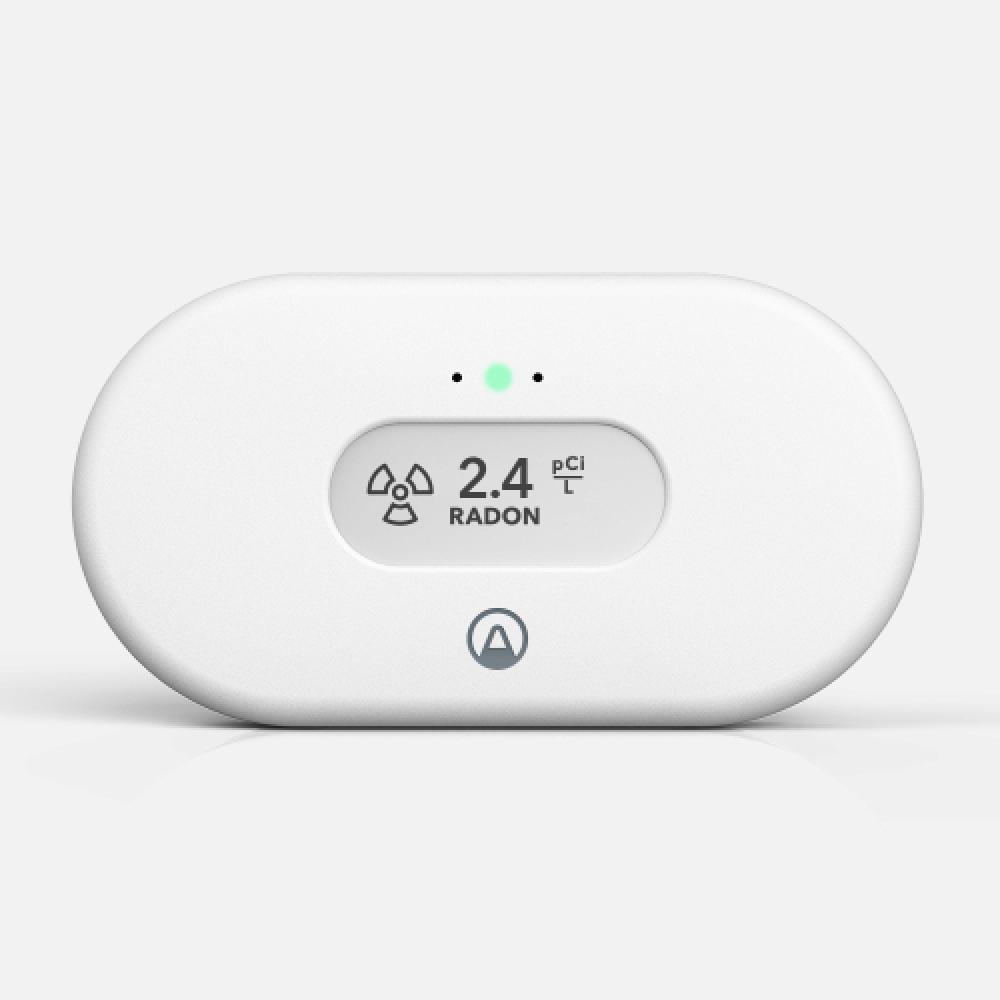
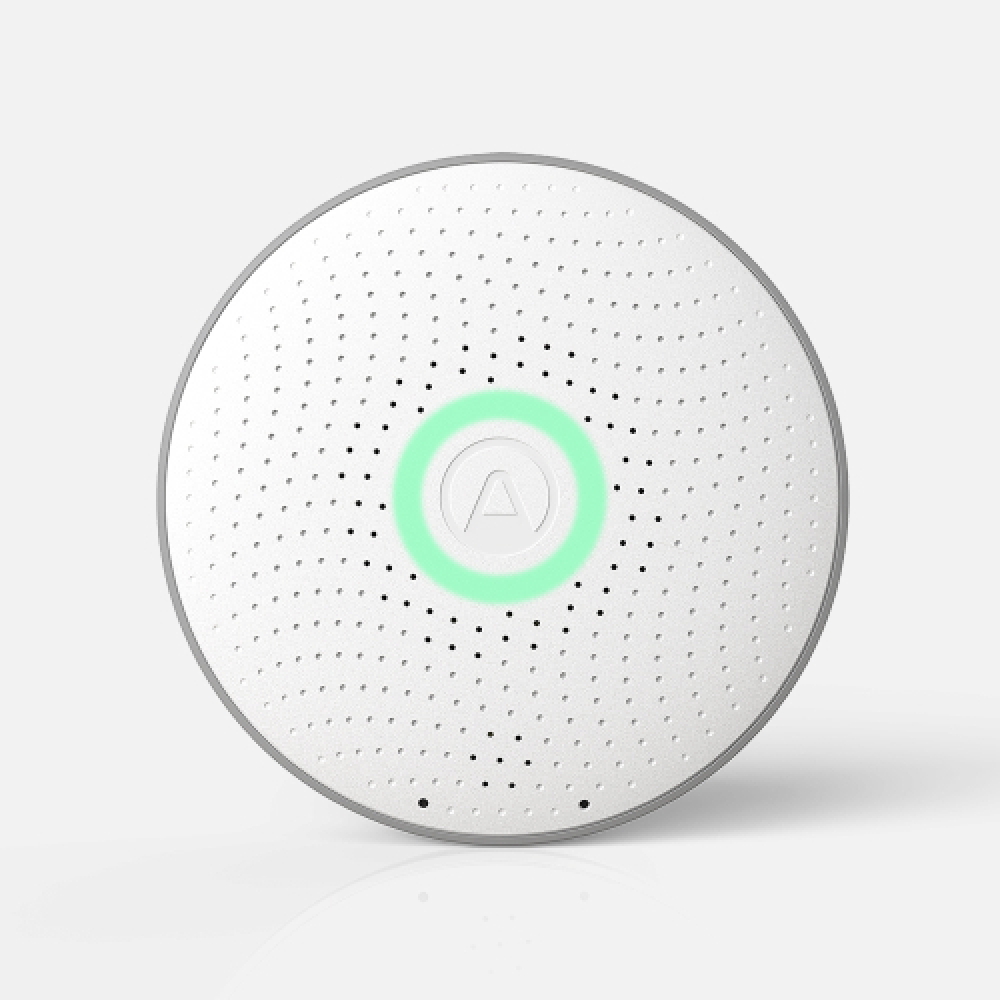
By monitoring, we can take control of the air we breathe in every day, and ensure it is as clean as can be. An easy way to do this is with an Airthings Wave Plus monitor, our most extensive detector, which measures radon, airborne chemicals, CO2, humidity, temperature, and air pressure.
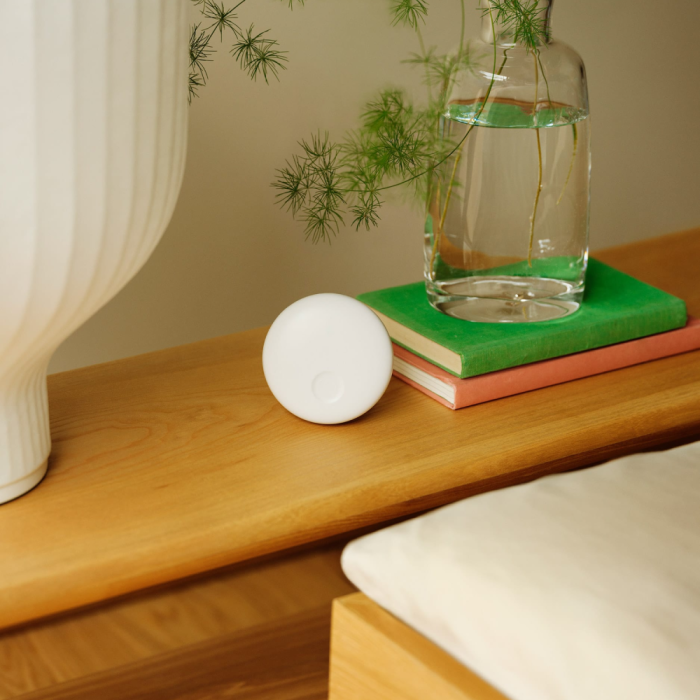
By simply waving your hand in front of your monitor, you can get a visual indication of your air quality levels. The red and yellow light indicate poor and fair levels, while the green light indicates healthy levels.
As people started working from home, the percentage of monitors in the US with fair and poor indoor air quality tripled.
Percentage of devices with poor & fair air quality in the US
Copy graph embed code.
Indoor air quality affects our health, but many of the pollutants that can cause problems are odorless, invisible and undetected until symptoms such as respiratory issues, fatigue, and sleepiness appear. By monitoring the air we breathe in our homes we have a valuable source of information to avoid indoor air hazards and ensure the wellbeing of our families.
This report’s insights are sourced from anonymous, aggregated data from Airthings Wave Plus monitors, filtering out outdated and inactive devices. In total, we used 1,264 monitors in the United States and 923 in Norway to collect this data.
Sources:
- https://www.epa.gov/indoor-air-quality-iaq/volatile-organic-compounds-impact-indoor-air-quality
- https://www.epa.gov/indoor-air-quality-iaq/volatile-organic-compounds-impact-indoor-air-quality
- https://www.ncbi.nlm.nih.gov/pubmed/15660567
- https://www.yaleclimateconnections.org/2016/07/indoor-co2-dumb-and-dumber
- https://www.epa.gov/indoor-air-quality-iaq/volatile-organic-compounds-impact-indoor-air-quality

%20(1)%20(1)%20(1).webp)
 Back to top